|
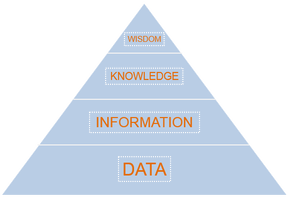
It’s been a busy few months. On top of my full time job as a Business Intelligence Officer (and a parent), I’ve delivered some great data visualisation workshops and had the joy of visiting the beautiful city of Ann Arbor to speak at a conference at the University of Michigan. I’ve also become a student again. I’m currently studying online for an MSc in Psychology with Coventry University. This has come as a surprise to some people as the importance of Psychology to data visualisation is not always well understood. However, for me Psychology is the most important aspect of data visualisation and I’d like to tell you why. Why Psychology?My initial introduction into the world of data visualisation came through attending a workshop by Stephen Few in 2013. I’d still recommend his book ‘Show Me The Numbers’ as one of the best introductions to the topic, alongside Alberto Cairo’s ‘The Functional Art’. One of the things I appreciate most in the writings of Stephen Few and Alberto Cairo are their appreciation of how understanding human behaviour is key to creating effective data visualisations. The most fundamental reason why understanding Psychology is key to creating good data visualisations comes through considering our goal of converting data into wisdom: The success of a data visualisation should always be judged on whether it has had its intended impact on its audience. This usually equates to the successful transformation of data into wisdom. An understanding of Data Science and Statistics can help us turn our data into information. However, it is turning information into knowledge that I believe is the most challenging and important aspect of the journey from data to wisdom. Information is presented as pixels/ink on a screen/page while knowledge and wisdom are found in the overwhelmingly complex interplay between the 90bn+ neurons in the human brain. Through studying Psychology I aim to develop my understanding of how to bridge this gap from information to knowledge so that I can develop my understanding of what makes an effective data visualisation. The 2 aspects of Psychology that most directly relate to data visualisation are perception and cognition: Perception (noun) “the ability to see, hear, or become aware of something through the senses.” Cognition (noun) “the mental action or process of acquiring knowledge and understanding through thought, experience, and the senses.” Human beings are a highly visual species. Sight is the sense that most strongly influences, not only how we see the world, but also how we think about and try to understand it. This is the simple reason why creating visualisations is the most effective way to communicate with data. Through studying Psychology, I aim to learn more about perception as the first stage of interpreting any data visualisation. The next stage involves extracting information from that visualisation in order to turn it into knowledge. A fully functioning optic system will have no problem presenting our minds with the visual image of a chart or a table, but what cognitive processes take place to allow us to interpret and understand what we are perceiving? Studying cognition is therefore fundamental to understanding how we can best turn information into knowledge. One of my main objectives in studying Psychology is to better understand the complex processes and interactions that occur within our perceptual and cognitive systems when we are presented with a data visualisation. People are Always More Important than Technology...In an increasingly data-driven world, it is important to remember that people are always the most important aspect of any process. People’s habits and ideas are also the most difficult thing to change. Through studying Psychology, my ambition is to further my understanding of people. I want to know more about how we see, think and communicate so that I can apply this knowledge to the challenge of how to effectively communicate within our data-driven world.
Better technology will not provide the solution to this challenge. Only Psychology can provide the answers to the big questions in data visualisation. ______________ If you’d like to know more then please consider attending or hosting one of my workshops (see events) and please don’t hesitate to get in touch if you have any questions or comments.
0 Comments
Leave a Reply. |
ABOUT MEAll content & opinions are those of the author Archives
July 2020
Categories |
|


 RSS Feed
